Background
The Department of Internal Affairs compiled the statistics from local authority elections, which are held every three years. Local authorities include city, district and regional councils, district health boards (DHBs), community boards and particular trusts (such as licensing trusts). The information compiled includes the number and types of votes for each ward or constituency, voter turnout, and the number of women standing as candidates and elected.
The 2016 elections were the tenth since nationwide restructuring of local government in 1989. The 1989 elections are the base year for comparisons.
The Department of Internal Affairs thanks all electoral officers and local authorities for providing the data, and would also like to thank Local Government New Zealand, the New Zealand Society of Local Government Managers, and the Local Government Commission for their assistance with this project.
This data release is provided as “open data” (in the form of spread sheets), to encourage reuse. Releasing the data in the form of spread sheets makes the information more readily accessible to, and useable by, key users of election statistics (such as government agencies, councils and researchers) who often combine it with other information. This is also the first release to include pivot tables which are intended to make the data more user-friendly and easily accessible.
Election statistics from the 2013 local authority elections are also included in this release.
The 2016 election statistics were sourced from a combination of public information provided by local authorities and a questionnaire sent to all electoral officers. The data has been carefully checked to ensure accuracy, but due to the volume and number of sources involved in the data collection, there may be some errors that are beyond our control.
Voter turnout and women candidates
Voter turnout and the participation of women as candidates are the most commonly used or requested statistics from the local authority elections. Charts illustrating the trends in these over the last 28 years are shown below. The Electoral Commission provides information on voter turnout at general elections.
Voter turnout in local authority elections has generally been declining over the last 28 years. The results from 2016 however show a slight stabilisation in voter turnout, with 43% voting compared to 42% in 2013. While the 2016 voter turnout figure is slightly higher than 2013, it is still quite low in comparison to the voter turnout in 1989 (57%).
Higher turnout in the 2010 elections was partly attributable to increased local voting for the first Auckland “super city” election and increased voting in Christchurch following the 2010 Canterbury earthquake.
Trend in local authority voter turnout
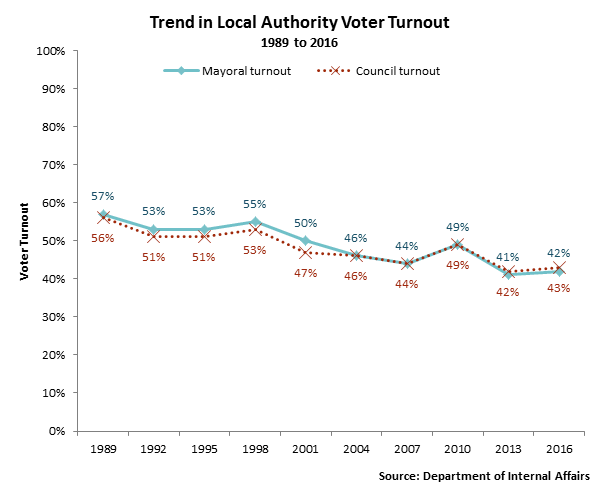
[INSERT LONG FORM DECSRCIPTION]
Voter turnout continues to be higher for district councils than for city or regional councils, but all councils have seen a decline in turnout since 1989.
Voter turnout by Council type
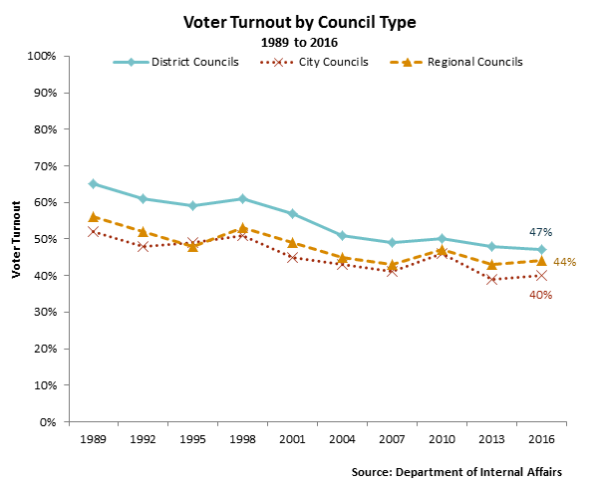
Note - Turnout based on councillor elections for city, district and regional councils.
The proportion of women elected to local authorities has been rising since 1989. The 2016 results show the highest percentage of women candidates (35%) and women elected (38%) in the last 28 years.
Proportion of women candidates and elected members
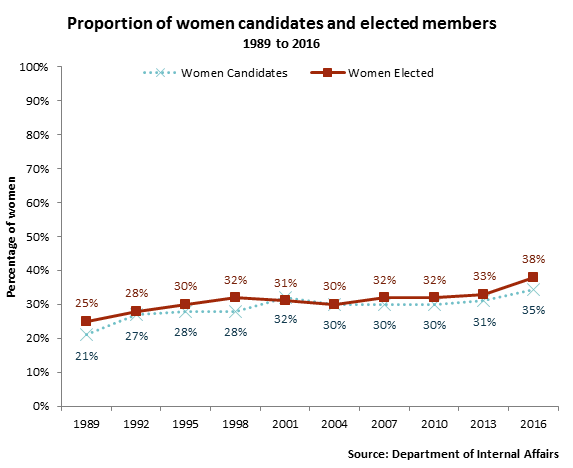
Note: This chart covers all local authority elections – mayoralties, councils, community boards, trusts and District Health Boards.
District health boards tend to have the largest amount of women elected, with over half (53%) of the electable positions being held by women following the 2016 election.
District councils saw noticeable increases in the proportion of women, with the percentage of women candidates and elected members increasing from 29% and 30% in 2013, to 36% and 34% in 2016.
Proportion of women by election type
Full data set
The full data set, including the above graphs and 2022 local elections statistics, can be downloaded as an Excel or CSV file below.
Local election Statistics 2016 (XLS, 2.61MB)
2016 Local Authority Election Data (CSV, 1.55MB)
License
This work is licensed under the Creative Commons Attribution 4.0 licence. In essence, you are free to copy, distribute, and adapt the work, as long as you attribute the work to the Department of Internal Affairs and abide by the other licence terms.
To view a copy of this licence, visit https://creativecommons.org/licenses/by/4.0/.