Background
The Department of Internal Affairs compiled voting statistics from local authority elections (local elections), which are held every three years. Local authorities include city, district and regional councils, district health boards (DHBs), local and community boards, and trusts (such as licensing trusts).
The 2019 local election is the eleventh since the restructuring of local government in 1989. The 1989 local election is the base year for comparisons.
The Electoral Commission provides information on turnout at General Elections.
2019 Local Authority Election Statistics
The 2019 local elections statistics are sourced primarily from a questionnaire sent to all electoral officers. Information for each electoral ward includes the number of eligible voters, number of actual voters, number of special and invalid votes, number of candidates, number of sitting members seeking re-election, number of women candidates, and number of women elected.
The statistics are provided as open data, in the form of spreadsheets. Releasing the statistics in this form makes the information more accessible to, and useable by, interested parties (such as government agencies, councils, and researchers).
The prepared statistics represent the official record of voter turnout for local elections. To ensure accuracy, the data was carefully reviewed and checked. However, due to the volume and number of sources involved in the data collection, there may be some errors which are beyond our control.
The Department thanks all electoral officers for providing the data. The Department would also like to thank Local Government New Zealand and the New Zealand Society of Local Government Managers for their assistance with this project.
2019 Local Authority Election trends
Voter turnout (turnout) and the representation of women as candidates and elected members are the most commonly requested local elections statistics. Charts illustrating these trends over the last 31 years are shown below. Corresponding brief descriptions of these statistics are in the form of proportions, identifying and comparing these across local elections.
Voter turnout
For turnout, the total percentage represents the number of electors on the roll.
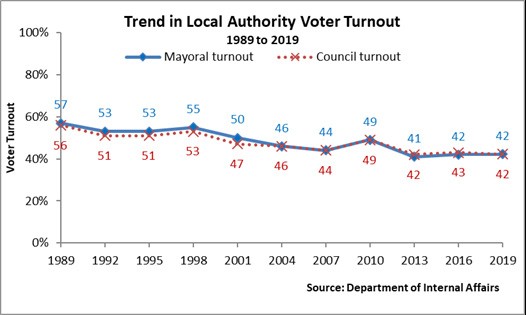
Read the long description for the trend in local authority voter turnout graph
Note: Mayoral turnout includes contested elections of mayors for city and district councils. Council turnout covers contested city, district, and regional council elections. Uncontested elections are not included in this statistic.
Since the nationwide restructuring of local government in 1989, turnout has declined from 57% to 42.2% in 2019. Results over the past three elections show an overall stabilisation in turnout.
Higher turnout in the 2010 elections is partly attributed to increased local voting for the first Auckland “super city” election, and in Christchurch following the 2010 Canterbury earthquake.
Voter turnout by Council type
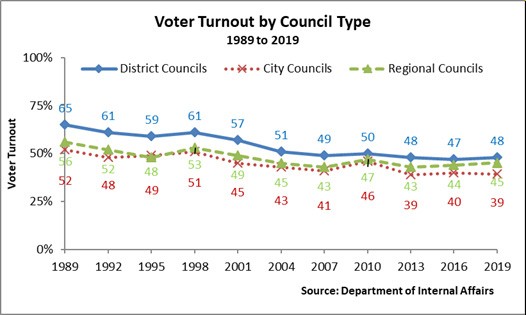
Read the long description for the voter turnout by Council type graph
Note: Voter turnout based on councillor elections for city, district, and regional councils.
While turnout for all council types has declined since 1989, turnout is generally higher for district councils than for city or regional councils. Since 2013, turnout for regional councils has gradually increased.
Representation of women
For the representation of women as candidates and elected members, the total percentage represents the number of all candidates and elected members respectively.
Proportion of women candidates and elected members
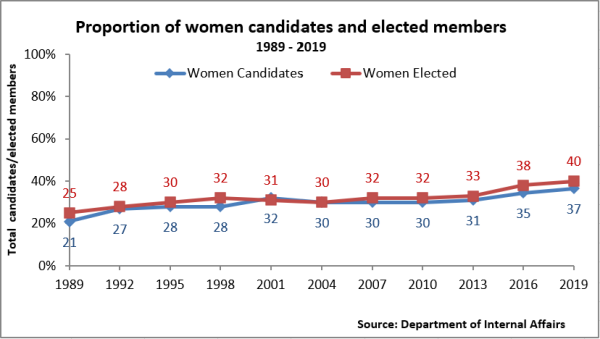
Read the long description for the proportion of women candidates and elected members graph
Note: This chart covers all local authority elections, including mayoralties, councils, community boards, trusts, and DHBs.
Since 1989, the proportion of women elected to local authorities is incrementally but continuously rising. The 2019 results show the highest percentage of women candidates (37%) and elected members (40%) out of the total group of candidates and elected members in the last 31 years. Compared to 2016, the number of women candidates and elected members increased by 126 and 64 respectively.
Proportion of women candidates and elected members
Read the long description for the proportion of women candidates and elected members graph
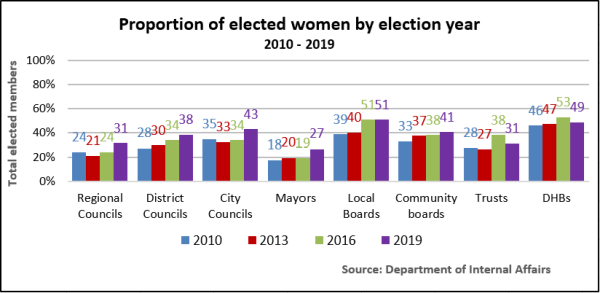
The proportion of women elected to most areas of local government is steadily increasing. Local boards have the largest representation of elected women overall, with 51% of electable positions held by women. Parts of local government where women elected members increased most notably between the 2016 and 2019 local elections are regional councils (+ 7%, 11 members), city councils (+ 9%, 16 members), and mayors (+ 8%, 5 members).
Similar to preceding years, district councils saw increases in the number of women elected, increasing from 34% to 38% with 25 additional women elected. For DHBs, the proportion of women elected dropped to 49% from 53% (less 5 women members) in the 2016 local elections. However, this remains higher than the proportion of women elected in several other areas of local government.
Proportion of women by election type
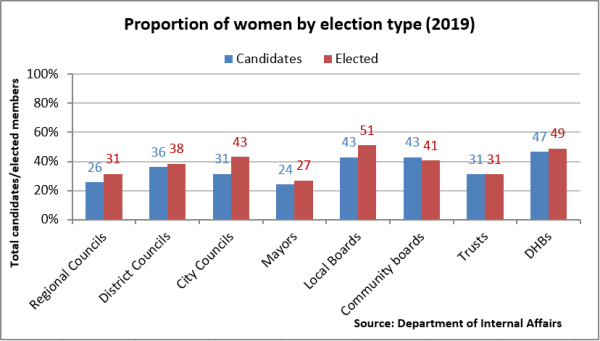
Read the long description for the proportion of women by election type graph
The most significant increase in representation of women as candidates and as elected members is for city councils. These indicate that although women made up 31% of the total candidate pool, they won 43% of the electable positions. Similar trends occurred for most areas of local government included in the 2019 local elections, excluding community boards and trusts.
Full data set
The full data set, including the above graphs and 2022 local elections statistics, can be downloaded as an Excel or CSV file below.
Local Authority Election Statistics 2019 (XLS, 270KB)
2019 Local Authority Election Data (CSV, 134KB)
License
This work is licensed under the Creative Commons Attribution 4.0 licence. In essence, you are free to copy, distribute, and adapt the work, as long as you attribute the work to the Department of Internal Affairs and abide by the other licence terms.
To view a copy of this licence, visit https://creativecommons.org/licenses/by/4.0/.